
America is famous around the world for its love of cars. The manufacturing of automotive vehicles began in the late eighteen hundreds and continued to grow with enhancements in technology. According to a new report by Center for Automotive Research (CAR), more than seven million people are currently employed in private sector automotive companies whereas, a total of 1,553,000 people are employed in different sectors of the automotive industry involving designing, engineering, manufacturing and supplying parts and components to assemble motor vehicles. There was a time when the Detroit three Chrysler, Ford and General Motors dominated the U.S. market but as multinational companies like Toyota, Honda, BMW and Volkswagen etc. entered the market with fuel efficient and comparatively less expensive vehicles, competition grew. Foreign companies are currently responsible for 46 percent of all U.S. vehicle production, bringing in three percent of the total foreign direct investment (FDI) for the U.S. economy. A study conducted by Global Automakers; a group consisting of 30 foreign companies found that these companies have invested $72 billion establishing 425 facilities and offices in the country with 123,000 people being directly employed.
Economic developers are well aware of the opportunities that the automotive industry holds. The industry is historically known to contribute 3-3.5 percent annually to the GDP. When we look at current trends, manufacturers have been constantly trying to add new technology to their products. There is a lot going on in terms of progress in technology; from night vision pedestrian detection systems and comprehensive vehicle tracking to driver override systems, vehicles today are inter-connected. Vehicle –To-Vehicle communication is a network of vehicles through which the vehicles will send each other messages that would include data like speed, location, direction of travel, braking and loss of stability. The initial version of the V2V system will warn the driver through red lights or sound to make the driver aware about any problems the vehicle is facing while later versions may have control over the vehicle in cases of over speeding or loss of stability. According to ABI Research VP and practice director, Dominique Bonte, vehicle to vehicle communication will reach 62 % by the year 2027. Electric and fuel efficient vehicle production is also expected to increase in the future as TechNavio a research firm focusing on technology says that the global automotive inductive wireless charging market is expected to grow at a CAGR of 24.31 percent from 2014-2018.
The concept of autonomous vehicles gained momentum after Google declared that is was producing self-driving cars in late May 2014. Tesla is another company who has excelled in this technology. Tesla in October of this year introduced an autopilot mode for its Model S which makes it possible for it to autonomously steer within a lane, change lanes with the simple tap of a turn signal, and manage speed by using active, traffic-aware cruise control. Similarly, giants like Toyota, BMW, Nissan, Honda and many other vehicle manufacturers have entered the market to build affordable autonomous cars for the mass. Toyota in November of this year planned to invest a billion dollars in its Toyota Research Institute (TRI) a newly formed company which focuses on AI technology for automated cars and home products. Honda Motor Co. and Nissan Motor Co. are planning to bring out self-driving cars by the year 2020. This current trend looks promising for bringing in new projects along with jobs for the industry.
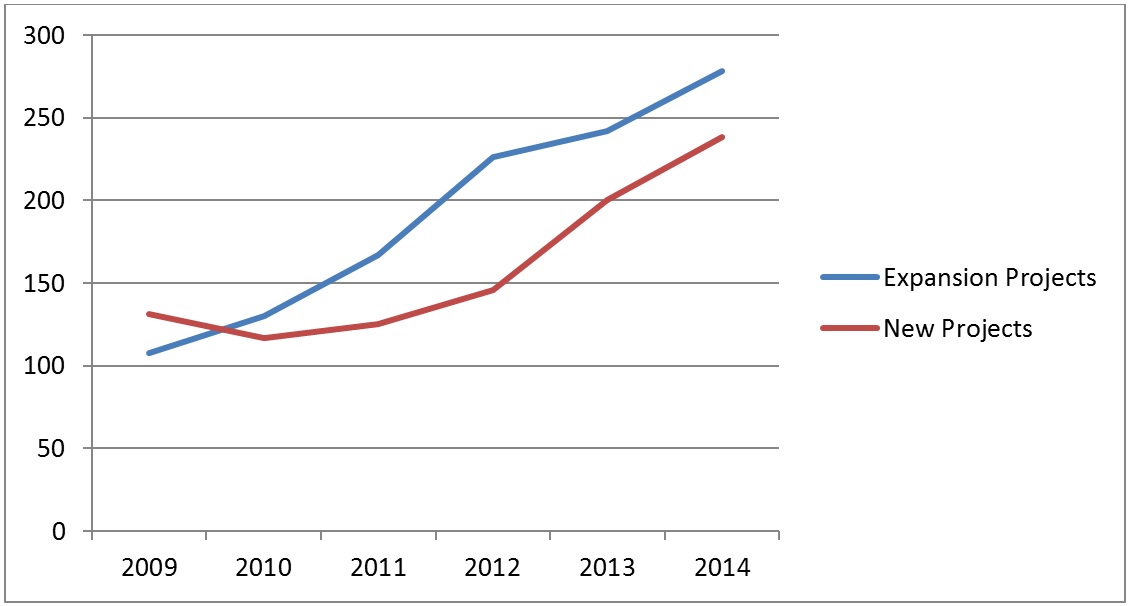
If we look at Conway data, there have been a total of 1151 expansion and 957 new projects from 2009 to 2014 with a grand total of 2108. We can see in the graph that there has been an upward trend in both new and expansion projects.
Figure 1: Expansion and new projects in automotive from 2009-2014[i].
 Source: Conway Data 2014.
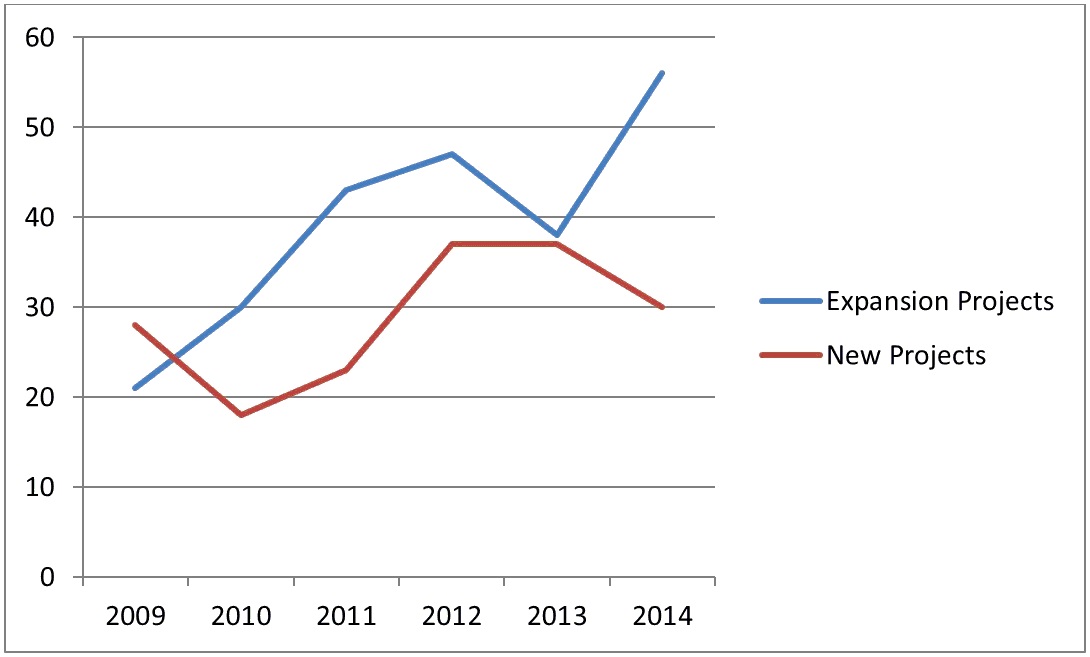
If we only take NAICS Code of manufacturers and suppliers of technologies like anti-car theft device, audio and visual device manufacturers, communications, research & design in engineering, there have been 235 expansion and 173 new projects from 2009 to 2014. There has been an upward trend in 2014 which saw the most number of projects a grand total of 86 expansion and new projects. However, there is decline in new projects from 37 in 2013 to 30 in 2014. Expansion projects seem to have declined in 2013 but 56 expansions were announced in 2014 that took it upward.
Figure 2: Expansion and new projects in innovative automotive technologies from 2009-2014[ii].

 Source: Conway Data, 2014.
(Note: The NAICS codes used to process data have been listed at the end.)
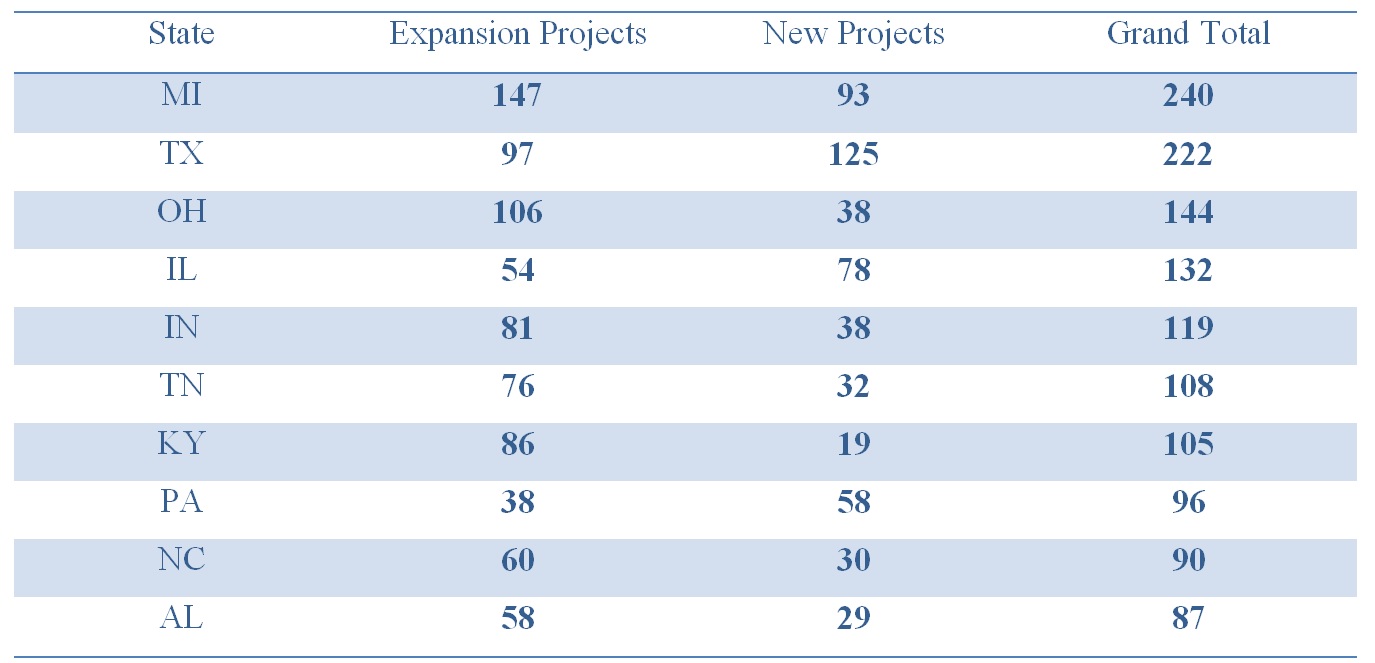
Michigan ranks number one bringing in a total of 240 projects followed by Texas and Illinois. Michigan has the highest number of projects and ranks 1st when we look at employment figures in the automotive industry with a total of 150,169 people having jobs in the automotive industry. Even though Texas is ranked second in terms of projects, it ranks seventh when we look at employment figures employing 33,776 people.
Table: Top ten states with projects from 2009-2014.

 Source: Conway Data 2014.
The future is bright for the automotive industry with the rising trend in both new and expansion projects corresponding to the innovation in technology. If current trend of rise in projects go hand in hand with newer better technology we will see a growth in jobs in automotive industry as well other industries such as construction. If numbers of electric powered cars and autonomous vehicles are to rise, we will need support in infrastructure as well. The automotive industry surely will provide economic developers with different opportunities to not just work with automotive companies directly but also to manufacturers of tech products and infrastructure development firms as well. Hence, automotive industry is win-win for all.