
The complete New & Expansion Projects data from Conway Analytics Report is finally here. So, how has 2015 been in terms of new projects & expansion projects? There have been a total of 5521 projects; 2201 new and 3320 expansion projects. In 2015, expansion projects have increased by 5 percent whereas new projects have decreased by more than 16 percent compared to 2014.
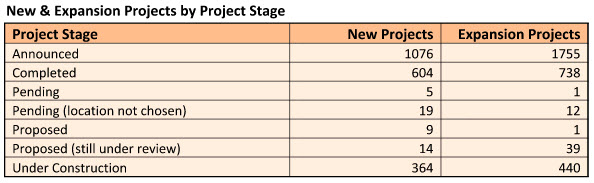
Of all the projects in 2015, there were 1076 new projects announced as well as 604 new projects completed. Similarly, 1755 expansion projects were announced and 738 completed.
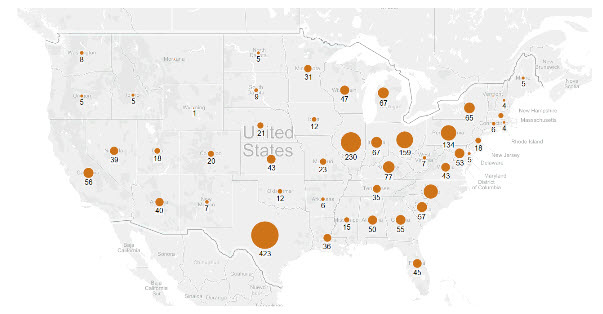
Most Active States
New projects in 2015 have decreased to a mere 2201, down almost to the number of new projects reported in 2010 after a steady increase over the last three years. States such as Texas, Pennsylvania, Illinois, Indiana, and Kentucky have had a significant improvement in the number of new projects compared to 2014. On the contrary, Tennessee, Florida, Georgia, Michigan, Oregon, California, Ohio, and North Carolina had a sharp decrease in the number of new projects.
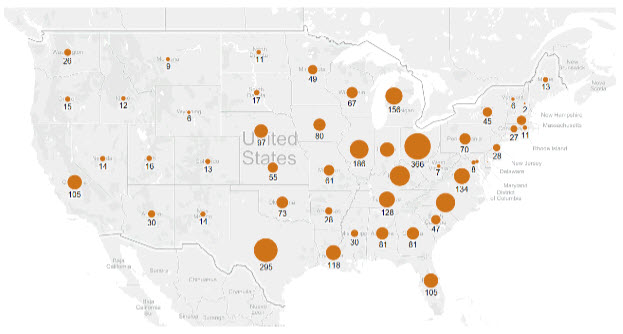
Unlike new projects, expansion projects have steadily increased over the last five years. There were a total of 3320 expansion projects in 2015. Ohio had the highest number of expansion projects with 366. Kentucky, Texas, North Carolina, Virginia, Tennessee, Florida, and Nebraska had the biggest gains in expansion projects whereas Illinois, Indiana, Louisiana, Pennsylvania, and Wisconsin had a drastic decrease.
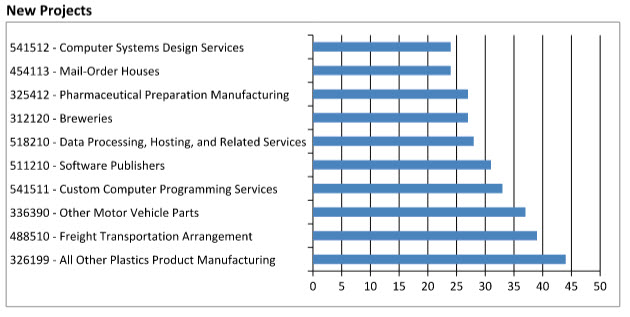
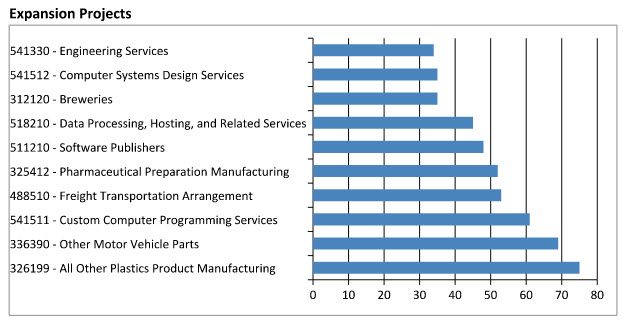
2015 Most Active Industries (6 Digit NAICS Code)
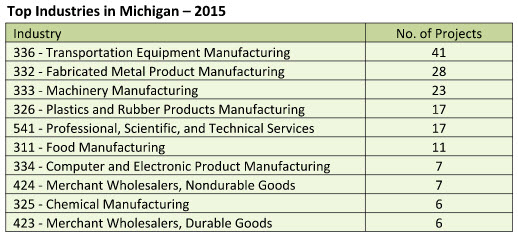
What’s happening in our home state of Michigan?
Michigan has had a decrease in number of new projects over the last three years. There were 142 new projects in 2013, 81 in 2014 and 67 in 2015. Expansion projects have also decreased over the years, from 209 projects in 2012 to 156 projects in 2015.
Of all the projects in 2015 in Michigan, Fabricated Metal Product Manufacturing (332), Machinery Manufacturing (333), Plastics and Rubber Products Manufacturing (326), and Food Manufacturing (311) had a significant increase in number of projects. On the other hand, Transportation Equipment Manufacturing (336), Professional, Scientific, and Technical Services (541), Merchant Wholesalers, Durable Goods (423), and Primary Metal Manufacturing (331) had fewer projects in 2015 than in 2014.
New & Expansion Projects must take place and meet one or more of the following:
1. Employees = 20 or more
2. Square Footage = 20,000 or more
3. Investment = $1,000,000 or more (construction cost, land, and building)
Renovations to buildings qualify based on investment ($1 million or more) or employees (20 or more).
Renovations do NOT qualify based on square footage alone.
Source: Conway Analytics Report