
Food processing in the U.S. has come a long way since the 1900s when trans-fat was first put into the supply chain. Companies started developing products that lasted for longer periods of time and were easy to carry. In the 1940s, products such as dehydrated juice and cake mixes were developed by the military, and these products were known as “convenience foods.” More and more companies entered the market as investors saw the opportunity in processed foods which not only created jobs but also led to a rise of the American food manufacturing industry around the world.
Today, companies like Coca-Cola Inc., Mars Inc. and ConAgra Foods are dominating the international market. Presently, Coke is distributed in more than 200 countries making the product a global icon. Similarly, Mars Inc., which started out as a candy manufacturer, now has departments looking after pet care, biotech, and food and beverage, distributing its products internationally. ConAgra Foods has 29 brands which bring in annual retail sales of $100 million each. Companies provide much needed jobs to communities. According to latest data from the bureau of labor statistics, more than 1.5 million people are currently employed by food manufacturing firms in America.
New & Expansion Projects in Food Processing
Construction of plants and expansions of facilities play a major role in providing communities with employment opportunities. Conway Data from 2011-2015, shows that there have been 1691 total food processing project announcements out of which 1033 were expansion and 658 were new projects. In the graph below, we can see an upward trend in both new and expansion project categories starting from 2011 continuing all the way to 2015.
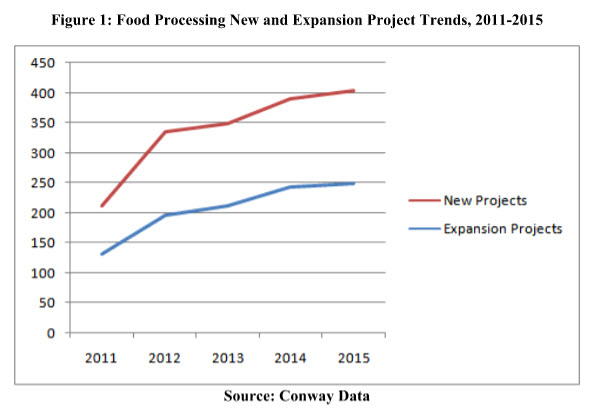
2015 had the most projects announced with 249 expansion projects and 155 new projects. This indicates growth of the food processing sector. If this trend continues there will be an increase in the number of projects in 2016. (Note: The NAICS Codes used to analyze data have been listed below.)
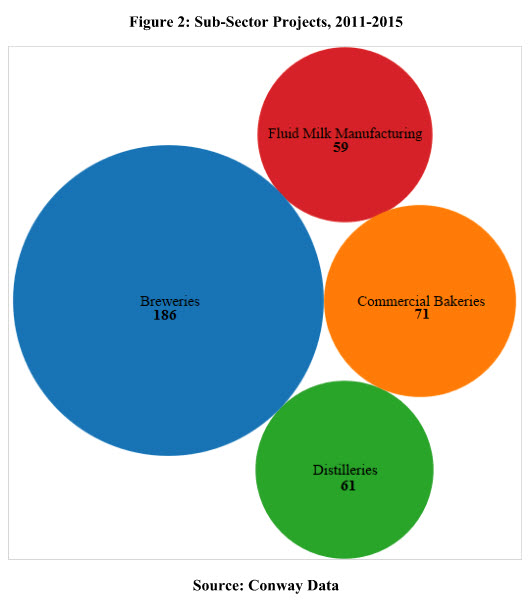
Looking at the sub-sectors within food processing, breweries have had the most projects with 186 total projects. Commercial bakeries had 71 projects, distilleries have had 61 projects, and fluid milk manufacturing had 59 projects announced from 2011-2015. Ohio had 15 brewery projects in 2014 and 2015 which is also the highest in brewery projects. Pennsylvania has the highest commercial bakery projects. If we look at projects announced by distilleries, Kentucky has 40 projects out of 61 total projects. In Kentucky, 25 projects were announced during 2014 and 2015. New York has the highest projects announced by fluid milk manufacturers. Projects by breweries and distilleries are higher than other sub-sectors in the food industry.
If we take a look at the geographic distribution of projects in the country, Ohio comes in at the top with 124 total announced projects followed by Pennsylvania and Kentucky with 122 and 121 projects respectively. States from the Midwest and Southern regions dominate this list. Four states each from the Midwest and South rank on the top ten of this list.
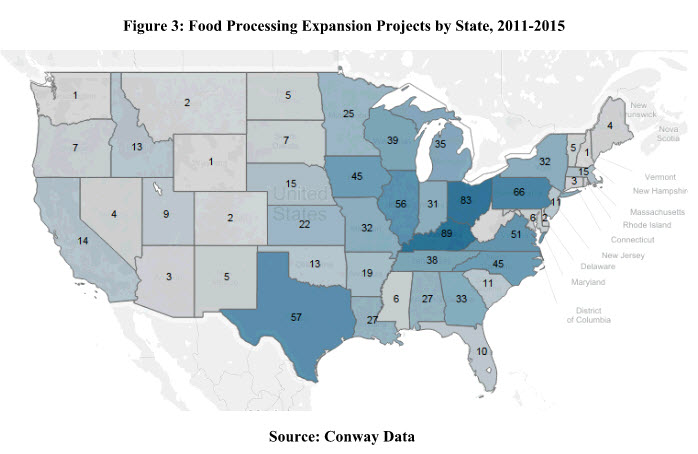
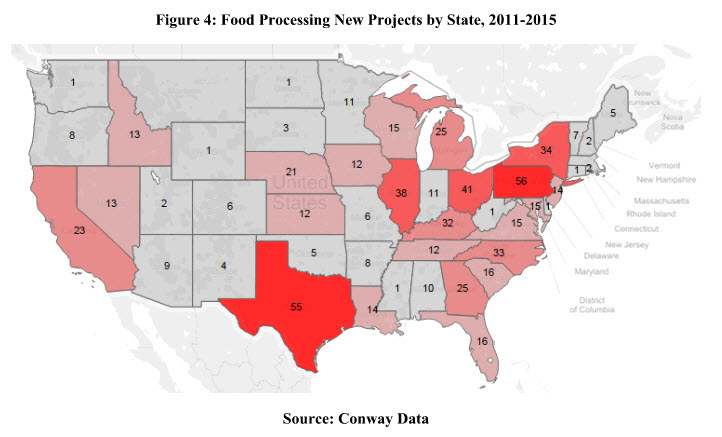
If we look at expansion projects, Kentucky is at the top with 89 projects followed by Ohio and Pennsylvania with 83 and 66 projects respectively. Pennsylvania has the largest number of new projects followed by Texas with 55 and Ohio with 41 projects.
In Kentucky, logistics has become the major attraction for companies. Kentucky offers access to 34 distribution zones containing two-thirds of the U.S. population. Businesses also have access to 19 interstate highways with controlled-access parkways, and 2,760 rail miles.
In Ohio, the low tax structure acts as an attraction for food companies. For instance, Nestle established a R&D center in Solon, Ohio on July 2015. In 2014, the company also expanded its facility in Dublin. As of September 2014, the company employed almost 2,500 people statewide.
Pennsylvania’s Lehigh Valley has the highest number of beverage manufacturers, more than the 66 counties in the state, according to an analysis from the Lehigh Valley Economic Development Corporation. There are a total of 222 beverage manufacturing companies in the state.
Research conducted by EMSI found that Chicago, New York City, and Los Angeles have the highest number of food manufacturing jobs despite the fact that food manufacturing only accounts for about 1% of jobs in these metro areas. The study also showed the top states with highest growth from 2009-2014 and found that the average annual earning in food manufacturing is higher than the average earnings for all industries. This has made the food industry beneficial for workers.
Innovation in Food Processing
Currently, a lot of interesting things are happening in food manufacturing. In 2014, Momentum Machines, a robotics company, invented a device that could produce 360 burgers per hour, preparing a burger in ten seconds. The company is currently rumored to be establishing a new restaurant to test its technical capabilities. Another company that has used innovation in its facility is Seattle based-craft beer maker Fremont Brewing. The company’s new 8,000 square foot facility is fully automated and is estimated to produce 60,000 barrels in 2016 whereas production for 2015 was 24,000 barrels, less than half of its current capabilities. Technology has helped companies expand production while keeping quality intact. According to new research conducted by PMII on food packaging and processing technologies, current trends among manufacturers include recycled and bio-degradable materials for packaging snacks and pet food, new films that have been developed to keep meat fresher longer with active labels to sense when meat is past its expiration.
The Processed Foods Debate
The argument about processed foods and chemical usage has been a hot topic in food manufacturing. The criticism of processed foods has been widely covered in mass media. An article from May 2015, published in Fortune Magazine points out why people have turned against processed foods. The high content of sugar in products and added chemicals were one of the main concerns of consumers. People have turned to organic food consumption as organic food sales have tripled over the past decade and increased 11% in 2014 to $35.9 billion, according to the Organic Trade Association. Research conducted by Credit Suisse analyst Robert Moskow, found that the top 25 U.S. food and beverage companies have lost an equivalent of $18 billion in market share since 2009. Companies need to gain consumer support by introducing products in demand and changing components in the manufacturing process.
Major brands have started changing their ingredients in their products and releasing organic brands to attract consumers. General Mills pledged to remove artificial flavors and coloring from its cereals, and Nestle announced that it would remove coloring and artificial flavors from its chocolate bars. Similarly, Campbell Soup Company announced the launch of their organic soup brand. These changes come at a time when 82% of baby boomers and 72% millennials believe that eating healthily is “extremely important,” according to research done by Alix Partners.
Future Growth and Strategy
PMII research found that the U.S. food industry will have a steady growth of 2.9% CAGR through 2022. This means that the processed foods industry gives economic developers more opportunities to create jobs and attract projects in the future. Trends in food production will change according to consumer demand and evolving technology. Demand for STEM field related jobs will also increase as technical advances in sciences will require employees to be qualified to run automated machines. Economic development agencies need to be able to plan out strategies to attract companies to their regions. Keeping up with the current trends will help develop strategies to attract businesses and seize the opportunities provided by the food processing industry.
i:NAICS Codes Used: 311111, 311119, 311211, 311212, 311213, 311221, 311224, 331225, 311230, 311313, 311314, 311340, 311351, 311352, 311411, 311412, 311421, 311422, 311423, 311511, 311512, 311513, 311514, 311520, 311611, 311612, 311613, 311615, 311710, 311811, 311812, 311813, 311821, 311824, 311830, 311911, 311919, 311920, 311930, 311941, 311942, 311991, 311999, 312111, 312112, 312113,312120, 312130, 312140.